How to test accessibility fixes using DevTools
Summary
You can test accessibility fixes in real time by combining the Siteimprove Accessibility Checker browser extension with browser DevTools, allowing you to simulate changes directly in the browser without needing to publish them.
Environment / Applicability
• Product/Feature: Accessibility Checker browser extension, Browser DevTools
• Version / Platform: Chrome, Firefox, Edge, Safari
• Audience: Accessibility specialists, developers, QA testers
• Geographic/Language considerations: None
Goal
How to test accessibility fixes using DevTools
The combination: the Siteimprove browser extension and browser DevTools together
The functionality DevTools provides is powerful when combined with the Siteimprove browser extension. When you see an error flagged by the browser extension, you can go through the following process quickly:
- Make an experimental fix through DevTools
- Run the Siteimprove browser extension again
- See if your experimental fix made that error go away
- If the error is gone now: you’re done. Otherwise: go back to step 1
You can do these steps in seconds rather than minutes for a “single page re-check” in the platform, and without needing to wait for a recrawl by the platform. This is especially useful if you are not someone who has “write” access to the content management system. You can try many experiments, see what works, and then send an email with your specific recommendation(s) to someone who has “write” access to the content. This is more efficient for everyone involved, and is easy to do with the combination of the Siteimprove browser extension and browser DevTools.
Example: the “Headings are not structured” rule
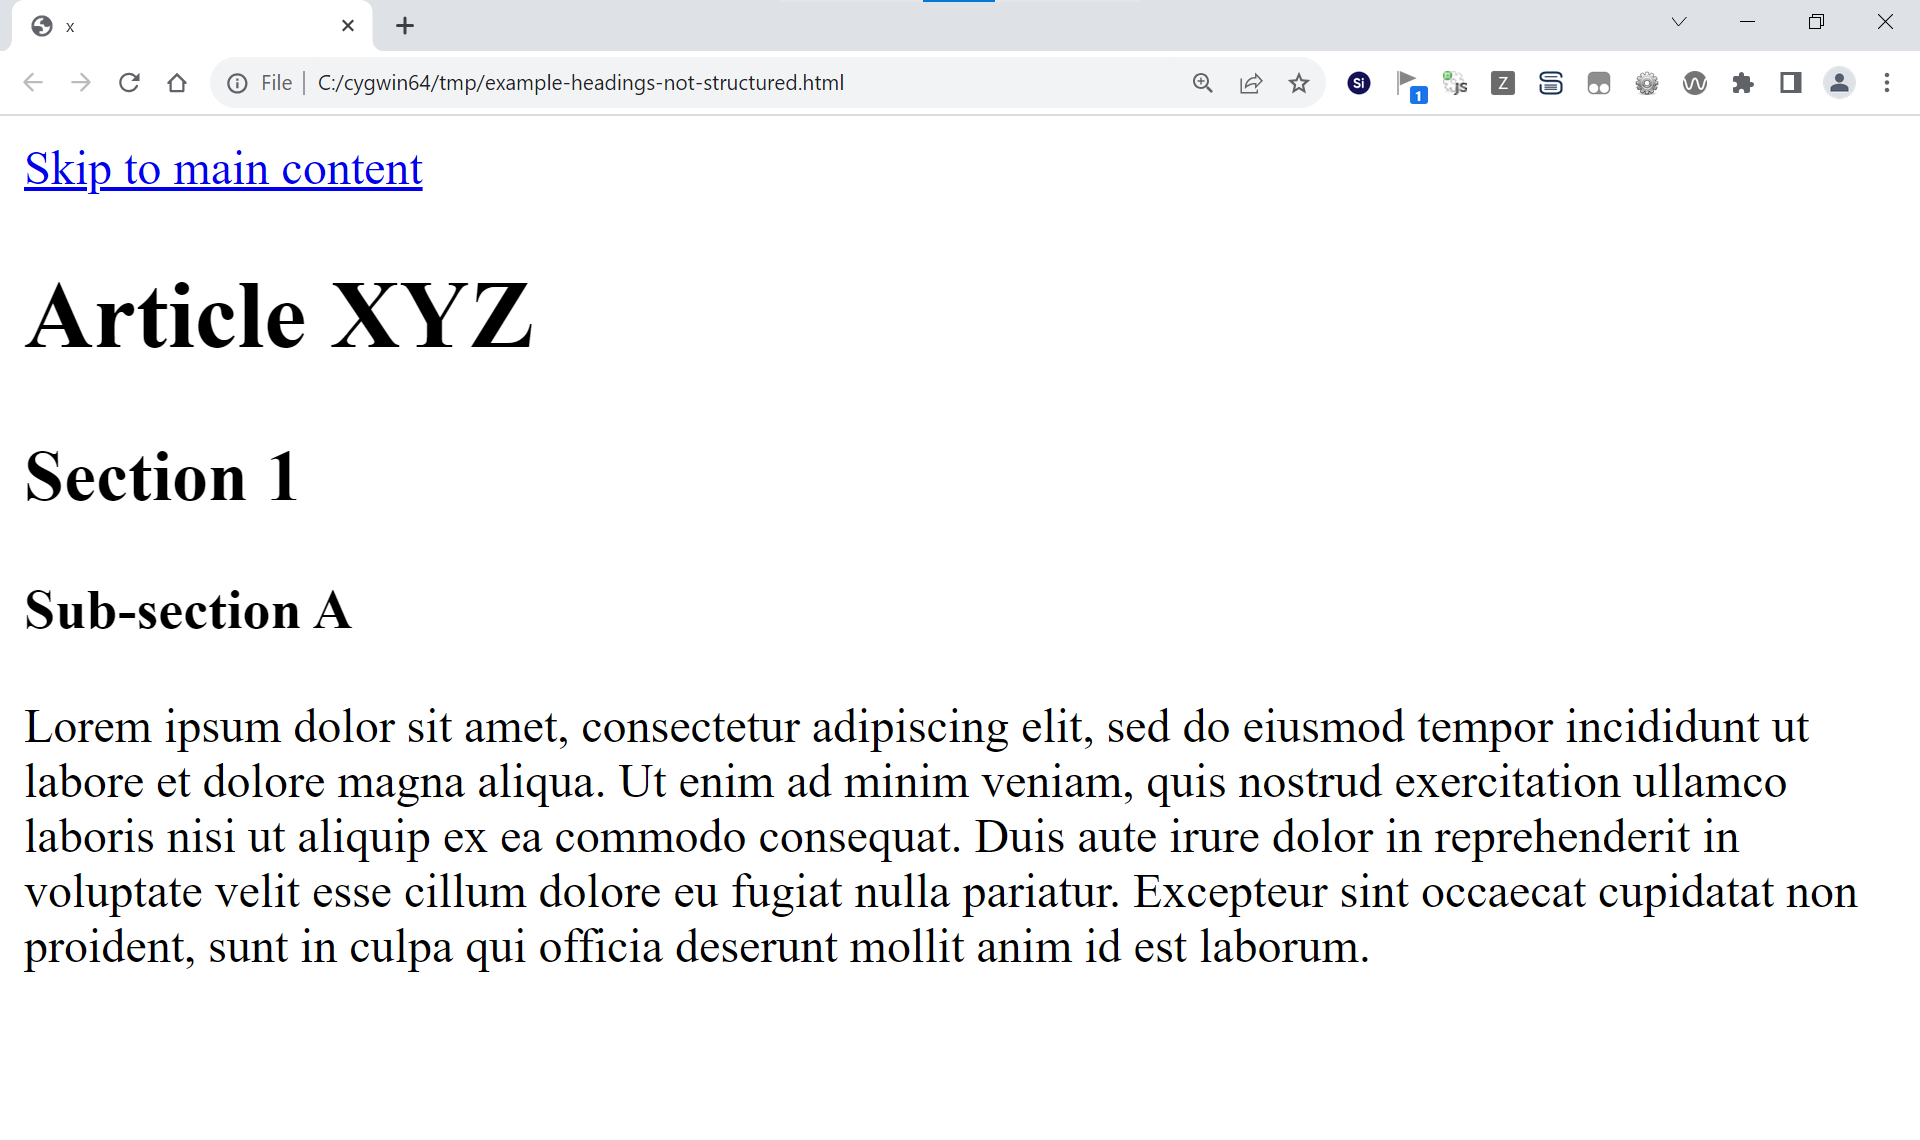
Consider a web page that looks like this:
Here, using DevTools:
- Run the browser extension on this page by clicking it’s button in the extension toolbar (1)
- The browser extension will then pop up a new window (2)
- In it, we’ll see an error for the accessibility rule “Headings are not structured” (3):
 Click on the rule on at this point, and the “occurrence” (1) and the browser extension highlight on the page (2):
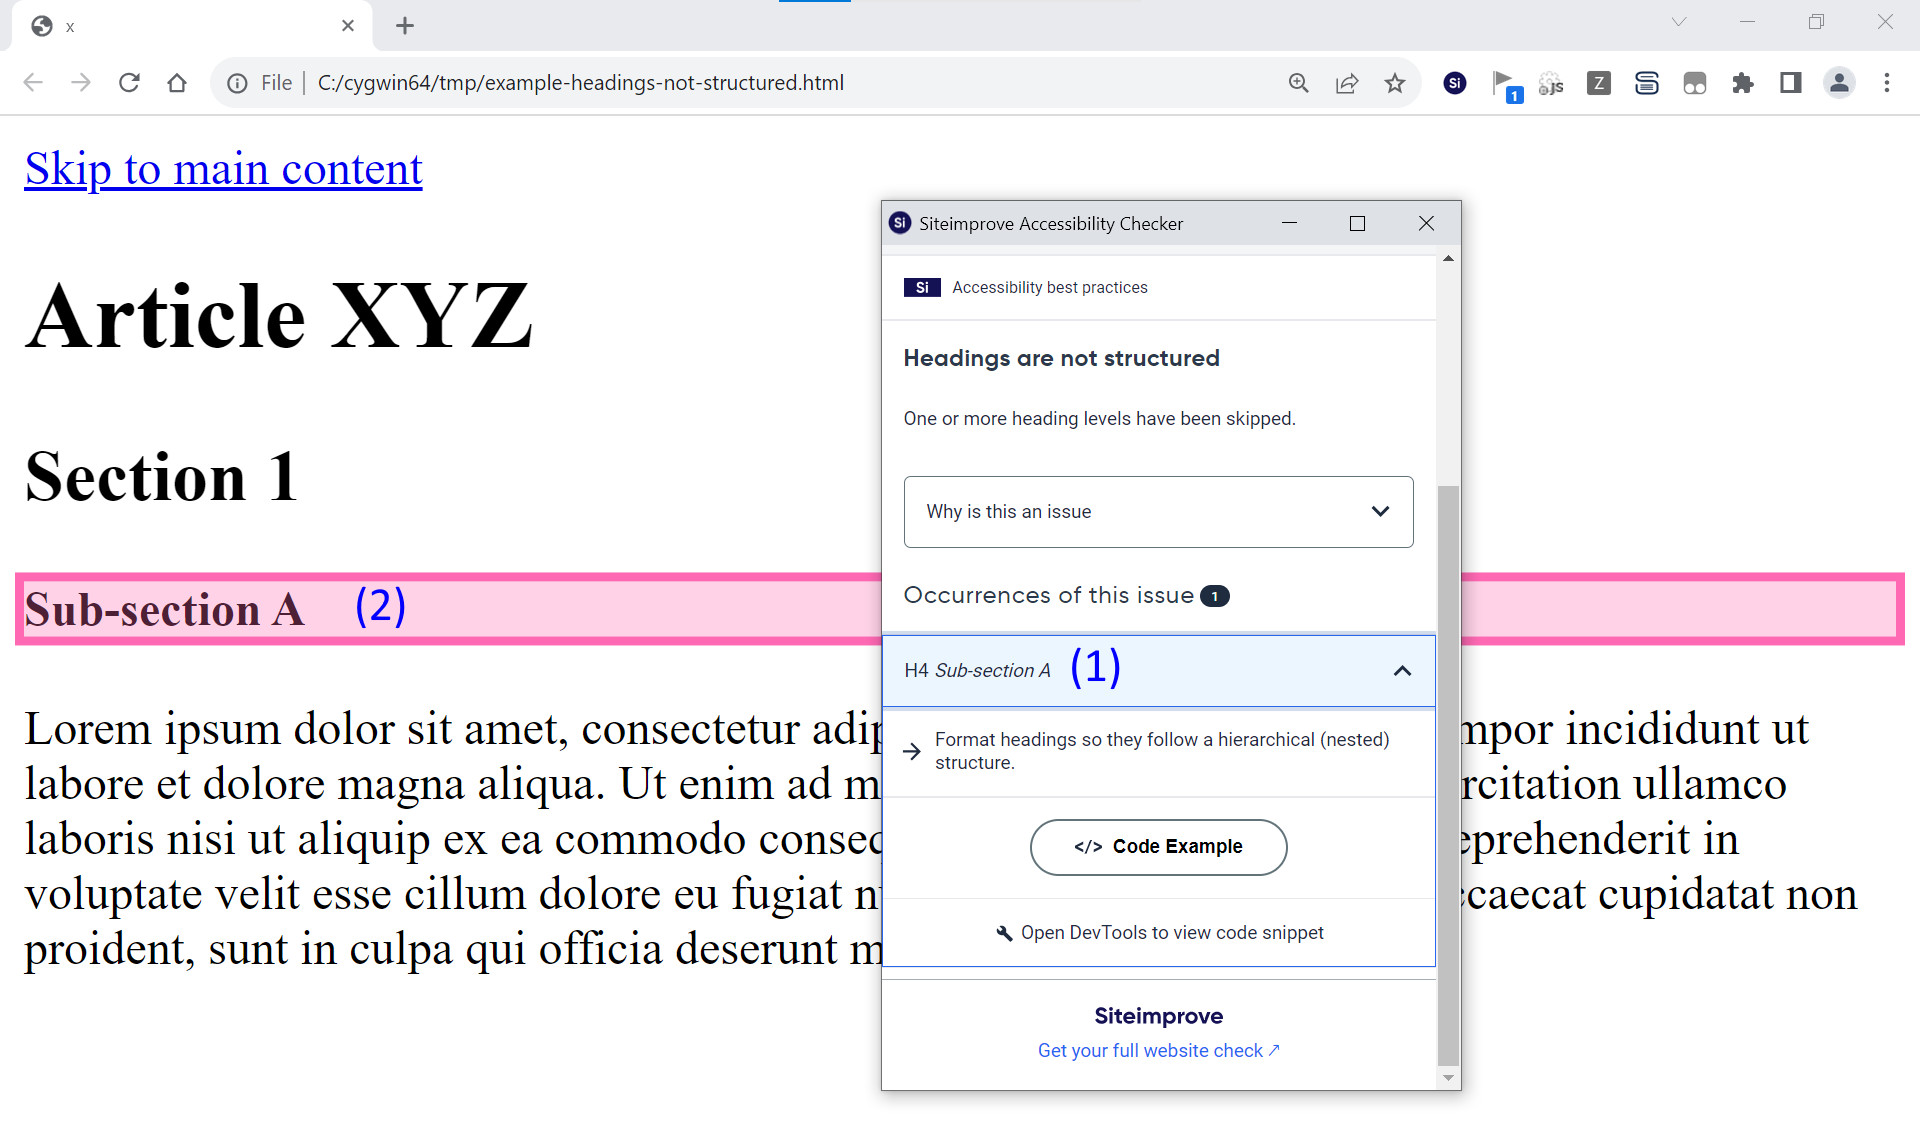
The browser extension tells us to “Open DevTools to view code snippet” (1), so we open DevTools. At the time of writing this article, on Chrome, DevTools can be opened by right-clicking anywhere on the main page then choose “Inspect” (2):
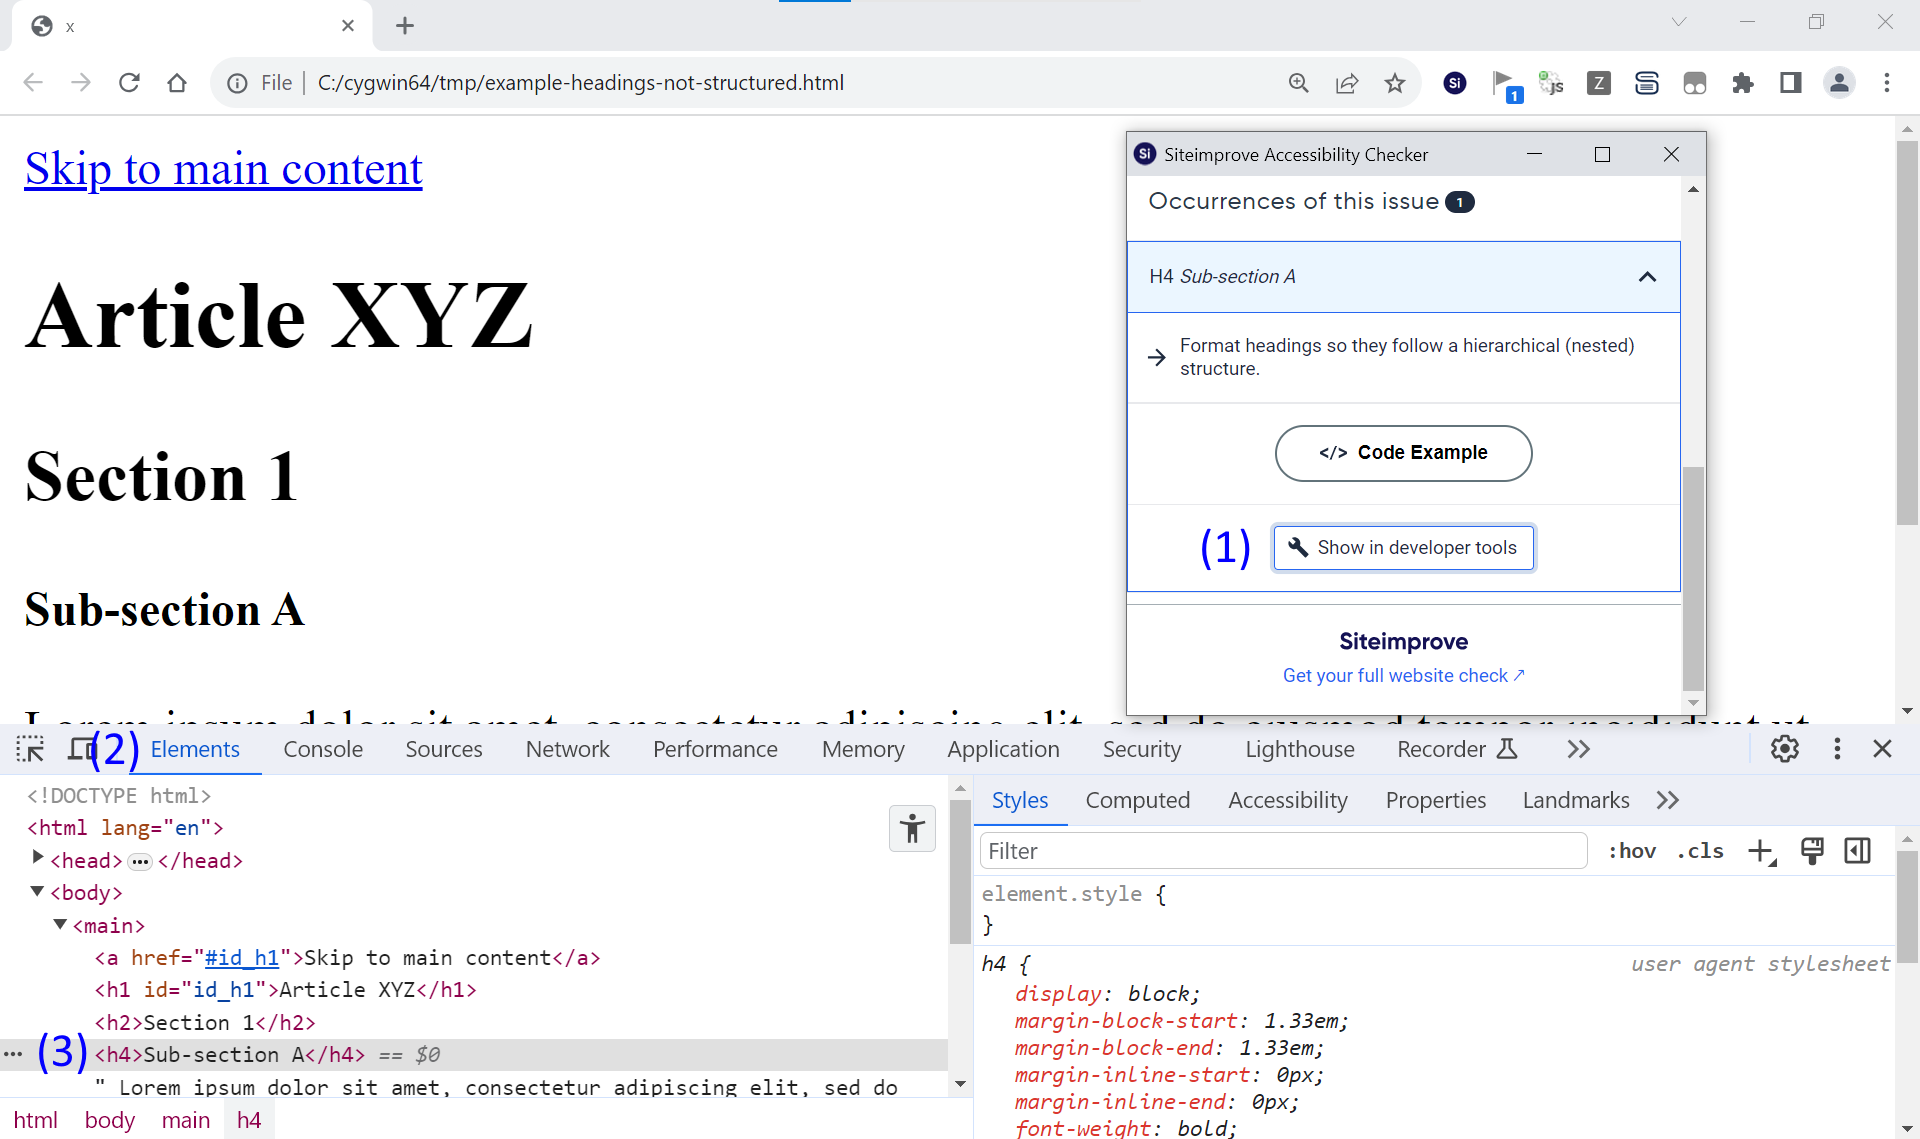
 The “Open DevTools to view code snippet” button will change to “Show in developer tools” (1). “Developer tools” is another way of saying “DevTools”. Clicking this will open the “Elements” tab in DevTools (2) and select the problem element (3) in that tab:
DevTools brings up a lot of information here. For this demo we can ignore most of it, especially everything that is not under the “Elements” tab.
If you get stuck with DevTools, we recommend that you first get acquainted with DevTools on its own by reading the documentation specific to DevTools on your browser. The documentation for the “Elements” or “Inspector” tab, and how to edit a page in DevTools, will be particularly useful.
Ignore tabs such as “Network”, “Performance”, “Memory”, and “Security” for now. When you have enough practice with DevTools on its own, then come back and read the rest of this example.
The problem element is this one: <h4>Sub-section A</h4>
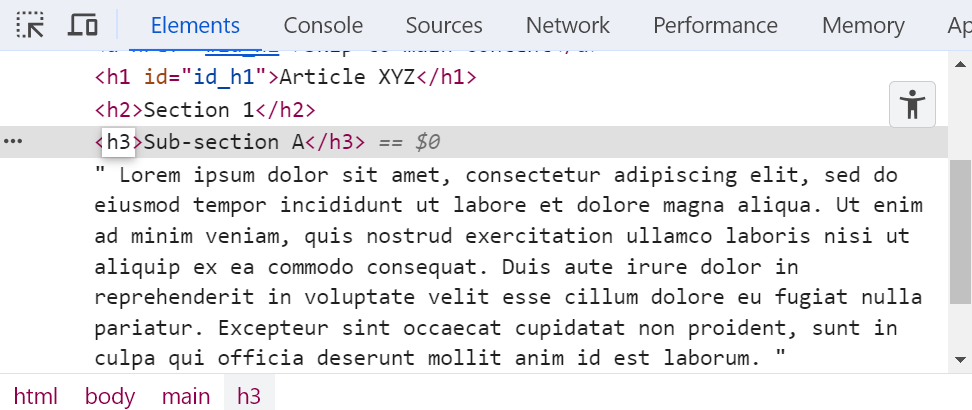
We know something about this accessibility rule: it insists that headings don’t skip a level. On this page we see that the headings do skip a level: from <h2> to <h4>, with no <h3> between them. So we can fix this by changing the <h4> into an <h3>. In Chrome DevTools, we do this by double-clicking on the “<h4>” tag, typing “h3”, then pressing ENTER:
Run the browser extension again by clicking its button in the toolbar again (1), and we see that the occurrence has disappeared (2):
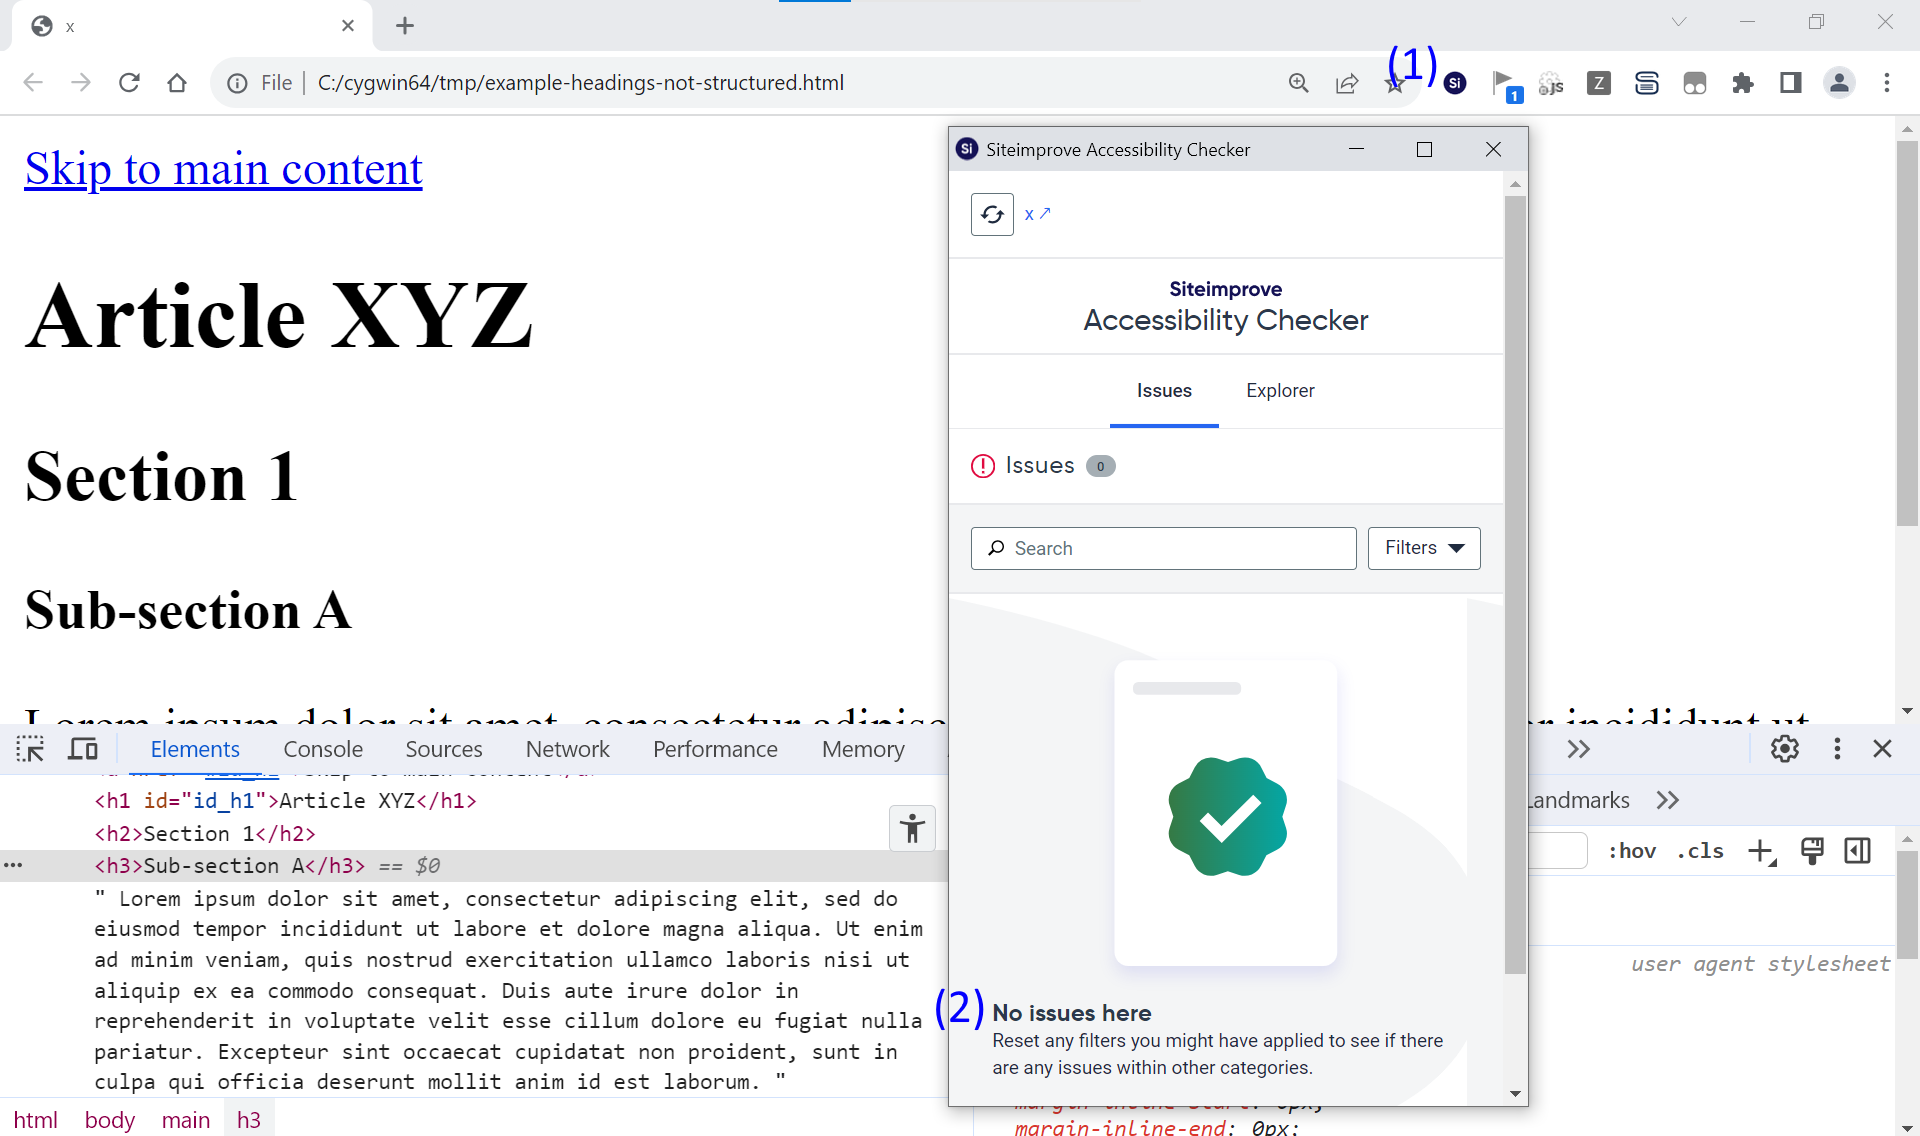
Since occurrence disappeared, the problem was successfully fixed. The change can now be made in the content management system so that our fix appears for all of our users.
The preceding screenshot also shows that the heading “Sub-section A” got bigger. This makes sense because an <h3> is supposed to be bigger than an <h4>.
Usability features in DevTools
If your first experimental fix doesn’t make the occurrence disappear, you might need to do more experiments. DevTools has features that will make such experiments easier. These vary by browser, but in general it’s almost as easy to edit a web page in DevTools as it is to edit a text file in Notepad. Try pressing Ctrl-Z or Command+Z to undo your latest change, or reload the page (usually Ctrl+R or Command+R) to effectively “undo all” of your changes. Try right-clicking, and you’ll likely see a menu with functions such as Cut, Copy, and Delete. Double-click on any text to edit it or, if double-clicking doesn’t do what you want, right-click and choose “Edit as HTML”.
Discrepancies with the platform
The Siteimprove browser extension doesn’t report all accessibility rules equally. You might find that an error is flagged by the Siteimprove platform for a certain page, and the browser extension says nothing about it. This can be confusing. The reason for the discrepancy is often that the issue was first flagged as a “potential issue” in the platform, rather than an “issue.” Potential issues have guided reviews, and guided reviews are only implemented in the platform – not the browser extension.
For the accessibility rules that sometimes present you with a guided review, you may or may not see the error flagged by the browser extension. These rules include the color contrast rules, “Skip to main content link is missing,” “Links in the same context with the same text alternative,” and others.
For the accessibility rules which never present you with a guided review, the browser extension will report all of the same errors that the platform reports. These rules include “Visible label and accessible name do not match,” “Container element is empty,” “Element IDs are not unique,” “Headings are not structured,” and more.
Another common reason for discrepancies between the Siteimprove platform and the browser extension is your site’s specific crawler configuration.
Conclusion
The combination of the browser extension and browser DevTools enables an efficient workflow for fixing accessibility errors. Whether you use it in conjunction with the Siteimprove platform or on its own, it can save you a lot of time.
Key takeaways
- DevTools allows temporary, real-time testing of accessibility fixes
- The browser extension helps identify issues that can be validated instantly
Did you find it helpful? Yes No
Send feedback