Working with the Siteimprove Report Template in Google Looker Studio (GLS)
Answer
When you connect Siteimprove to Google Looker Studio (GLS) you are presented with the Siteimprove Report template. This article gives information on working with that template.
This article covers how to copy, edit, and review the "Siteimprove Report Template" example as a jumping off point to get ideas of how you can utilize Siteimprove data in your own customized reports. You can navigate to the "Siteimprove Report Template" by following instructions in the article: Siteimprove Google Looker Studio connector and reports. We also share links to Google's resources which you will need to consult for questions about how to utlize the Google Looker Studio product to help you with creating your own reporting.
Note: Siteimprove provides the functionality to incorporate Siteimprove data within GLS. We are happy to help with questions regarding configuring the integration but do not provide support or product help for GLS. This article gives an example of how you could use Siteimprove data in GLS.
Prerequisites
- Follow the instructions in "Siteimprove Google Looker Studio connector and reports" to setup the Google Looker Studio (GLS), formerly Google Data Studio (GDS), integration and navigate to the "Siteimprove Report Template."
How to View the Siteimprove Report Template
As a prerequisite to this article you will need to follow the instructions in "Siteimprove Google Looker Studio connector and reports" to setup the Google Looker Studio (GLS), formerly Google Data Studio (GDS), integration and navigate to the "Siteimprove Report Template."
How to Copy the Siteimprove Report Template
You can’t edit the original default "Siteimprove Report Template," but you can copy it to create your own report and edit the data. This article explains how to copy the template.
- If you don't already have the "Siteimprove Report Template" open, click on the "Siteimprove Report template" from the GLS reports table to open it.
- From the main menu bar, click on the "Make a copy" button to make a copy.
- This will open the “Copy this report” modal. Here, you need to select "Siteimprove" as the New Data Source and click the “Copy Report” button.
- This will open a copy of the report in a new tab.
- The copied report consists of 3 pages:
- Overview - Getting started
- Account overview dashboard
- Site overview dashboard
- You can switch between the pages of the report using the Pages menu item.
- If you have issues with data appearing in the report elements (charts, tables, controls, etc) see: How to resolve errors with report elements.
How to Edit GLS Dashboard Report Pages and Elements
You can edit report pages to review or change which metrics are shown or to connect to a data source.
- To do this, click on the “Edit” button on the top menu bar to open the reporting editor.
- Once the Editor has loaded, click on the element (chart, table, etc) you want to review. This will bring up the editor sidebar. In this sidebar, you can review the setup, style, data and more areas.
- You also have the option to choose different dimensions and metrics to be shown in the element (chart, table, etc) in the report. See Dimensions and Metrics below for more information.
How to Resolve Errors with Report Elements
If something happens with the data source and it somehow gets disconnected from the report you will see error messages in the charts and tables in the report like in the screenshot example below. If this happens there are a few different options to get the data to display again.
How to Update the Data Source for Reports
If this happens you may need to reselect the "Siteimprove" data source for the chart, table, etc elements within report. Please review the steps below for how to update the data source for reports.
- Select a element in the report that needs to be updated like a chart, table, etc.
- Under the Data Source field select the "Siteimprove" data source.
- It should then process and update the data in the element within the report that you selected.
How to Resetup Data Souce Connection
If the steps above to update the data source for the reports doesn't work you will need to remove the "Siteimprove" data source, remove the connection, resetup the connection, then go into the charts, tables, etc and reselect the "Siteimprove" data source.
Dimensions and Metrics
You can add/edit data to a report using dimensions and metrics. You'll find useful information regarding dimensions and metrics in the Google article: Model your data - Configure the dimensions and metrics used in visualizations.
The table and images below show the dimensions and metrics used by default on each page of the "Siteimprove Report Template."
More information on Siteimprove data available in GLS can be found in the Siteimprove GDS Data model PDF. This data may not be up to data as we add new data, but it should cover most of what we offer. To get a better idea of what data is available you can connect to the integration and there is a searchable list of data point once you have the data connection setup.
Getting started
You can review the tables below and screenshots of the reports to see which dimensions, control fields, metrics, and sorting options are applied to the template charts. The steps in the charts shown in this article correspond to the numbering of the charts on the screenshots. Reviewing this information is useful when configuring custom charts in reports you may create. 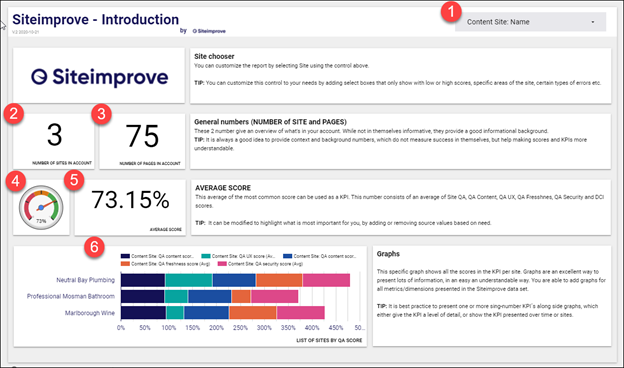
Report element 1
- Data source: Siteimprove
- Control field: Content Site: Name
- Metric: Page (count)
Report element 2
- Data source: Siteimprove
- Metric: Content Site (count)
Report element 3
- Data source: Siteimprove
- Metric: Page (count)
Report element 4
- Data source: Siteimprove
- Metric: Content Site: DCI score (Avg)
- Sort: Content Site: DCI score (Avg)
Report element 5
- Data source: Siteimprove
- Metric: Content Site: DCI score (Avg)
Report element 6
- Data source: Siteimprove
- Dimension: Content Site: Name
- Metrics:
- Content Site: QA score (Avg)
- Content Site: QA UX score (Avg)
- Content Site: QA content score (Avg)
- Content Site: QA freshness score (Avg)
- Content Site: QA security score (Avg)
- Sort:
- Content Site: QA score (Avg)
Account overview dashboard 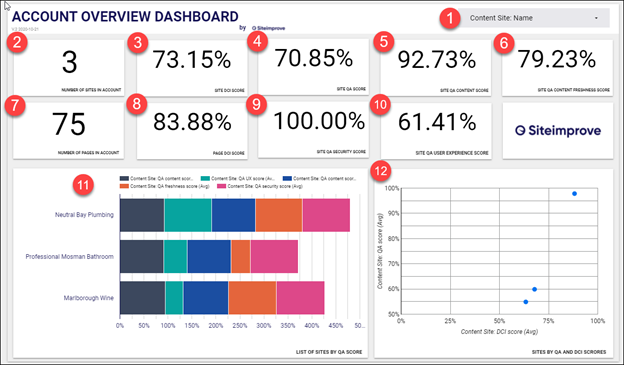
Report element 1
- Data source: Siteimprove
- Control field: Content Site: Name
- Metric: Page (count)
Report element 2
- Data source: Siteimprove
- Metric: Content Site (count)
Report element 3
- Data source: Siteimprove
- Metric: Content Site: DCI (Avg)
Report element 4
- Data source: Siteimprove
- Metric: Content Site: QA score (Avg)
Report element 5
Data source: Siteimprove
- Metric: Content Site: QA content score (Avg)
Report element 6
- Data source: Siteimprove
- Metric: Content Site: QA freshness score (Avg)
Report element 7
- Data source: Siteimprove
- Metric: Page (count)
Report element 8
- Data source: Siteimprove
- Metric: Page: DCI score (Avg)
Report element 9
- Data source: Siteimprove
- Metric: Content Site: QA security score (Avg)
Report element 10
- Data source: Siteimprove
- Metric: Content Site: QA UX (Avg)
Report element 11
- Data source: Siteimprove
- Dimension: Content Site: Name
- Metrics:
- Content Site: QA score (Avg)
- Content Site: QA UX score (Avg)
- Content Site: QA content score (Avg)
- Content Site: QA freshness score (Avg)
- Content Site: QA security score (Avg)
- Sort:
- Content Site: QA score (Avg)
Report element 12
- Data source: Siteimprove
- Dimension: Content Site: Name
- Metrics:
- X - Content Site: DCI score (Avg)
- Y - Content QA score (Avg)
- Sort:
- Content Site: DCI score (Avg)
Site overview dashboard
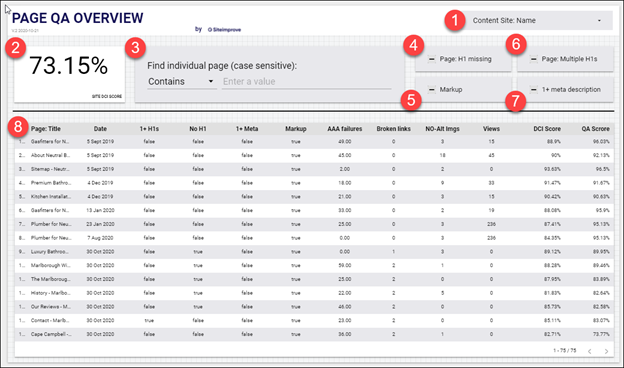
Report element 1
- Data source: Siteimprove
- Control field: Content Site: Name
- Metric: Page (count)
Report element 2
- Data source: Siteimprove
- Metric: Content Site: DCI score (Avg)
Report element 3
- Data source: Siteimprove
- Control field: Find individual page (case sensitive)
- Metric: Content Site: DCI (Avg)
Report element 4
- Data source: Siteimprove
- Control field: Page: H1 missing
Report element 5
- Data source: Siteimprove
- Control field: Markup
Report element 6
- Data source: Siteimprove
- Control field: Page: Multiple H1s
Report element 7
- Data source: Siteimprove
- Control field: 1+ meta description
Report element 8
- Data source: Siteimprove
- Dimension: Page: Title
- Metrics:
- AAA Failures
- Broken links
- 1+ H1s
- No-Alt Imgs
- No H1
- Views
- 1+ Meta
- DCI Score
- Markup
- QA Score
- Sort:
- Page (count)
- Date
Additional Resources
More Resources to Help Get Started on Creating Your Own Customized Reports
As well as exploring the configuration of the example "Siteimprove Report Template" provided by Siteimprove, you can learn about setting up reports from Google's Help Center articles.
Here are links to some useful GLS Help Center resources:
Did you find it helpful? Yes No
Send feedback