How to View Your Organization’s Course Progress
Answer
To view your organization's course progress, you must first have access to the Insights feature through the Analytics Admin role in Learning Hub. Once access is granted, you can use the Insights dashboards to review course enrollments, completions, learning plans, user engagement data, and export reports as CSV files.
Overview
The Analytics Admin role within Learning Hub provides access to reporting and analytics related to user course completion, enrollment status, learning plans, and engagement data. This article explains how to obtain access to Insights, navigate available dashboards, and export reporting data.
Prerequisites
Before viewing your organization's course progress:
- You must have the Analytics Admin role within Learning Hub.
- If you do not currently have access, contact learninghub@siteimprove.com to request access to the Analytics feature for your group.
How to Obtain Access to Insights
If you or another user within your organization would like access to these reporting capabilities, reach out to learninghub@siteimprove.com to request access to the Analytics feature for your group.
For this request, please include the following information to ensure this is done as quickly as possible:
- First and last name of the admin(s)
- Email address of admin(s)
- The company or organization name.
- ALL email domains associated with your organization.
Note: If there are any users within your organization that have an email with a public domain such as Gmail, Yahoo, Outlook, etc. Please include their exact email address to ensure they are added. Users with public domains cannot be automatically added to a customer group.
After receiving access to the Insights feature, you will now see a graph icon on the left-hand side of the home page. This tab will have the option of Insights and Background Jobs. 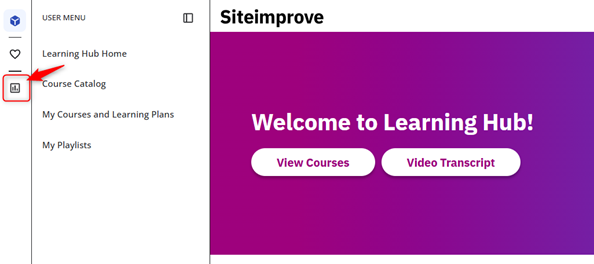
View Course Progress in Insights
Step 1: Open the Insights Area
After receiving access to the Insights feature, select the graph icon on the left-hand side of the home page and open Insights.
Step 2: Select a Dashboard
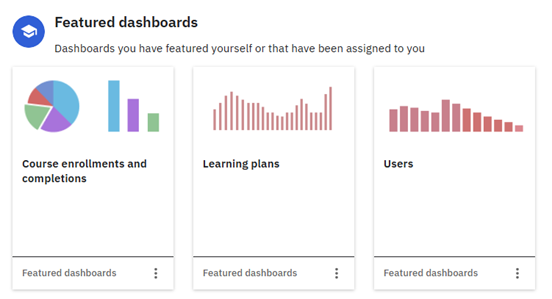
Insights will provide you with three main dashboards for user-related analytics:
- Course Enrollments and Completions
- Learning Plans
- Users
Step 3: Filter the Data
These dashboards can be filtered by:
- Courses
- Course categories
- Users
- User status
In addition, you can select any specific date range using the date selections at the top of the page.
Step 4: Review Dashboard Reports
There are approximately 10 to 15 different reports found in each of the dashboards. Each report has a unique visual ranging from percentages to bar graphs and trend lines.
Course Enrollments and Completions
This dashboard contains reporting related to course enrollments and completions. 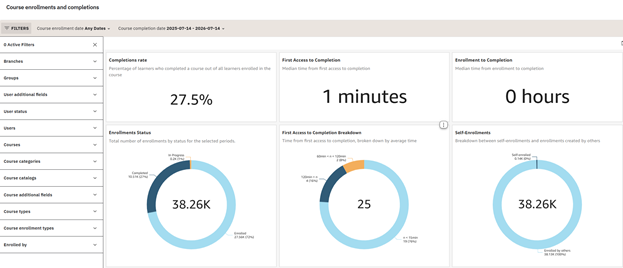
Learning Plans
This dashboard provides the same information and filters as the Course enrollments dashboard, including the same 15 reports, however they are specific to Learning Plans and does not include individual course completions and enrollments. 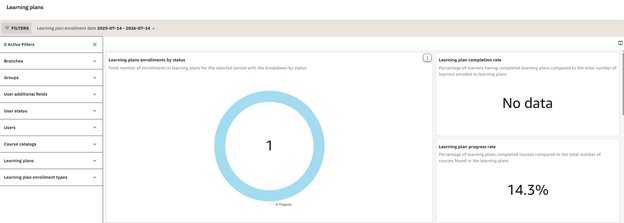
Users
This dashboard contains 11 reports specific to user engagement data. The primary use for these reports are to see how frequently or infrequently your users are interacting with the site and its content. 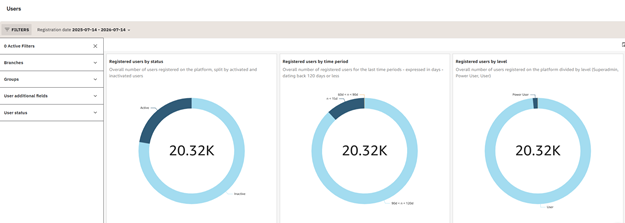
Export Report Data
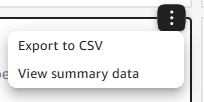
Hovering over each of the graphics, you’ll see a button appear in the top right corner of its window that contains three dots. This button will allow you to export the data into a csv format, or you can click “View summary data” to access a pop-up with a simplified version of the data.
Use Background Jobs
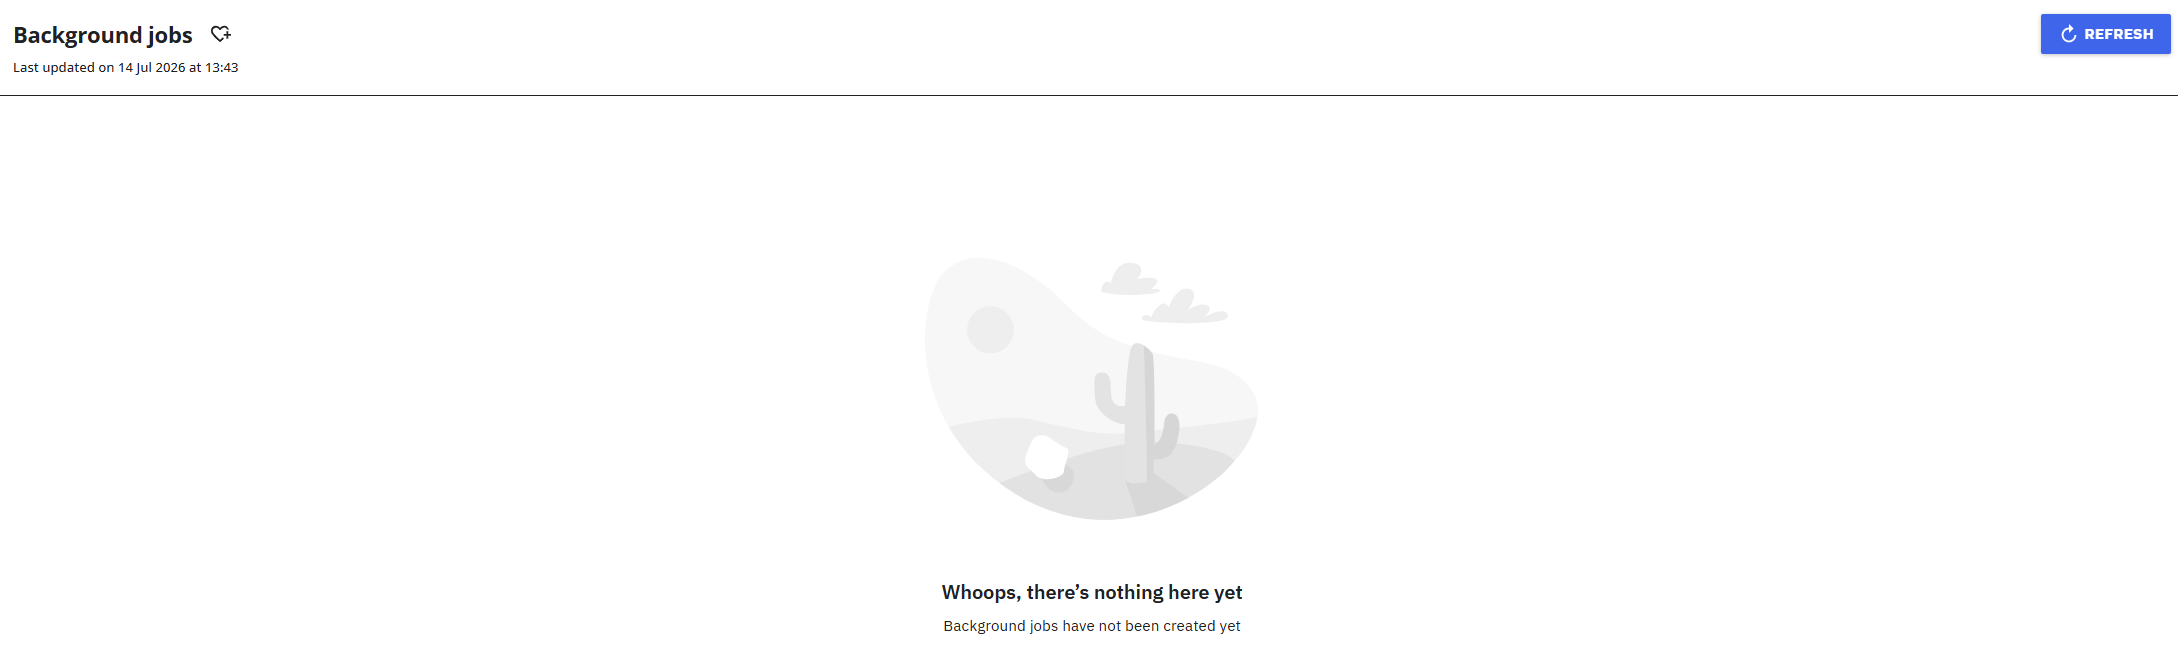
Background Jobs is primarily to list any reports you have run that may require more time to process. These will not occur often, if at all, so it is likely to remain blank with a message saying nothing is there yet.
Should a report appear here, it will appear in a list format with a download button on the far right-hand side that will export a CSV of the data. 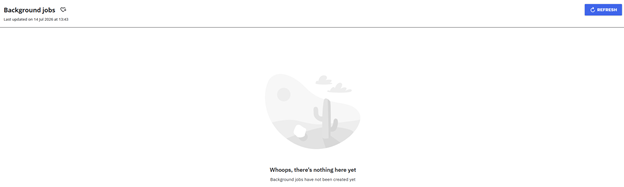
Notes
These reports will only provide data pertaining to your assigned group of users. If you find that a user is missing, please reach out to learninghub@siteimprove.com to ensure your group is up to date. In addition, you may see filters on the left-hand side that, when expanded, have no additional filters. This is because they are not filters that are applicable to your group.
Did you find it helpful? Yes No
Send feedback